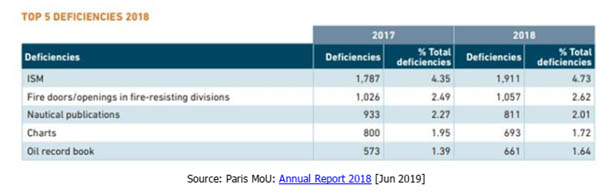
Oil record book still in top 5 deficiencies
01/07/2019 SAFETY4SEA
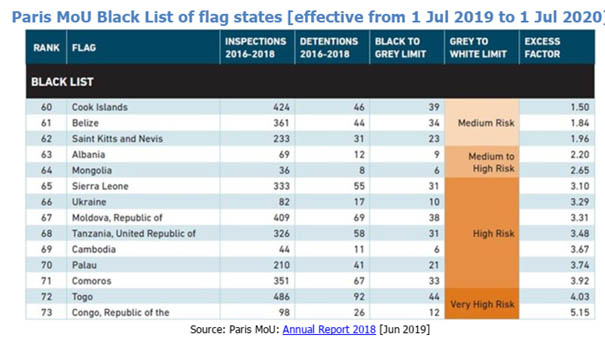
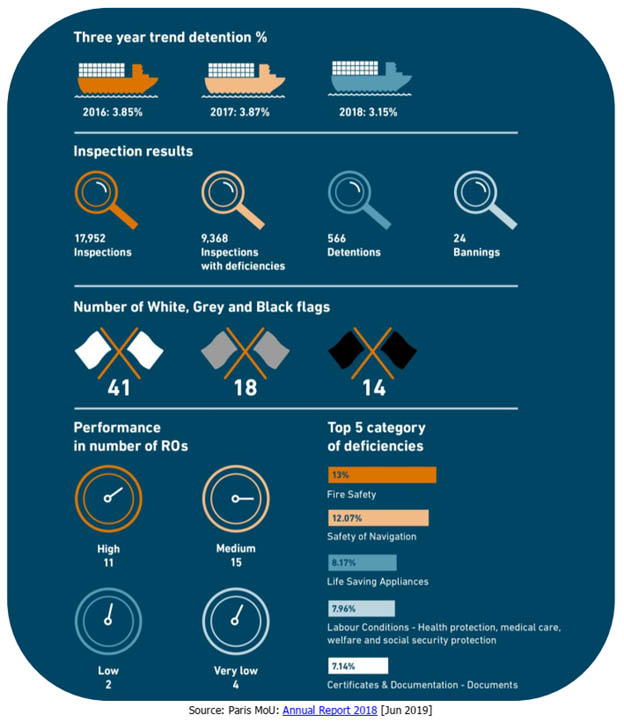
The Paris MoU on Port State Control issued its Annual Report 2018, noting that the detention percentage of 3.15% in 2018 has decreased compared to the 3.87% in 2017. The number of ships that received a refusal of access (banning) order has also decreased from 32 in 2017 to 24 this year. ISM was again at the top of the five most frequently recorded deficiencies in 2018.
Key figures 2018
- Inspections
- With a total number of 17,952 inspections performed in 2018, the inspection figures are almost similar to 2017 (17,923).
- The average of number of inspections per ship of 1.17 times per year equals that of 2017.
- Deficiencies
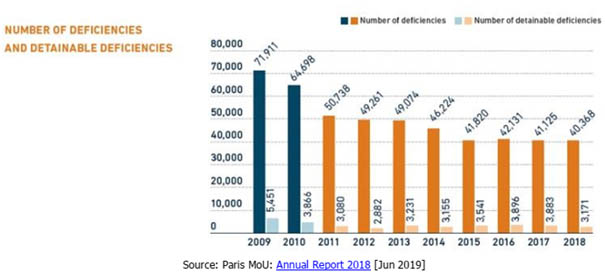
- The number of deficiencies over the past 3 years has been: 42,131 (2016); 41,125 (2017) and 40,368 (2018).
- The percentage of inspections performed with one or more deficiencies recorded, remained constant: 52% (2016), 52% (2017) and 52% (2018).
- The average number of deficiencies per inspection of 2.3 is the same as in 2017.
- Detainable deficiencies
- After two years of stabilising detainable deficiencies (3,896 in 2016; 3,883 in 2017), 2018 shows a significant decrease to 3,171. A relative minus of more than 18%.
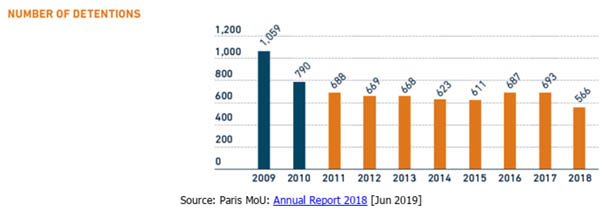
- Detentions
- Detention rates are expressed as a percentage of the number of inspections, rather than the number of individual ships inspected to take account of the fact that some ships are detained more than once a year.
- Compared to 2017, the number of detentions has decreased significantly from 693 to 566 detentions; a decrease of about 18%.
- Where the average detention rate in 2017 was still 3.87%, in 2018 it dropped to 3.15%.
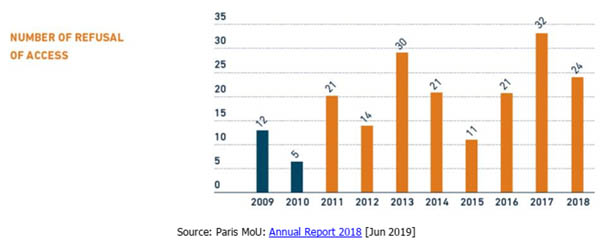
- Refusal of access
- A total of 24 ships were refused access (banned) from the Paris MoU region in 2018. 22 for reasons of multiple detentions, 2 for failing to call at an indicated repair yard.
- A number of ships remain banned from previous years.
- Several ships have been banned a second time after multiple detentions, resulting in a minimum banning period of 12 months.
- The total number of 24 is down from 32 in 2017.
- Deficiencies per main category
The number of deficiencies in the following six areas accounted for approximately 68% of the total number of deficiencies.- Certificates & documentation: The number of deficiencies recorded as related to ships’ certificates, crew certificates and documents show a decrease from 6,745 in 2017 to 6,275 in 2018. The relative part regarding the total deficiencies has dropped accordingly from 16.4% in 2017 to 15.5% in 2018.
- Safety of navigation: In 2018, deficiencies in Safety of Navigation accounted for 12.1% of all deficiencies recorded. The decrease related to 2017 when the deficiencies were 13.6%, is probably due to the CIC Safety on Navigation held in 2017. The number of deficiencies in Safety of Navigation decreased from 5,611 in 2017 to 4,874 in 2018.
- Fire safety: In 2018 deficiencies in fire safety accounted for 13% of all deficiencies recorded, similar to 2017. Although the percentage is stabilising, there is a slight further decrease in the number of deficiencies that were recorded: from 5,409 in 2016 via 5,385 in 2017 to 5,248 in 2018.
- Pollution prevention: The total number of deficiencies recorded in the several pollution prevention areas in 2018 were 2,973. The increase in the number of deficiencies compared to 2017 (2,025 deficiencies) can be explained by the new requirements resulting from the BWM Convention. The share of deficiencies in the several pollution prevention areas compared to the total number of deficiencies was 7.4% in 2018, while in 2017 this share was only 4.9%.
- Working and living conditions: Most deficiencies on working and living conditions (MLC 2006, areas table) have been found in the following areas. Health and safety and accident prevention (area 11) 3,090 (41.8% of all MLC deficiencies); food and catering (area 10) 1,260 (17.1%); hours of work and rest (area 6) 628 (8.5%); accommodation (area 8) 639 (8.6%) and seafarer’s employment agreements (area 4) 554 (7.5%) deficiencies. The percentage of deficiencies regarding working and living conditions, related to the total of deficiencies is 14.9%. A decrease from 15.5% in 2017 and 16.1% in 2016. The total number of deficiencies in 2018 was 6,006, a decrease from 6,372 in 2017.